- +1 (845) 367-4240
- info@colonialpropertymanagement.com
- 410A New York 59, Airmont, NY 10952, USA
One metric separates a profitable property from a volatile asset, and most New York investors never measure it.
A few emergency calls each month feel like business as usual. But in a reactive maintenance system, those “routine” emergencies can quietly consume up to 40% of your entire maintenance budget. Even when they account for just 5-15% of total work orders, emergency repairs are a direct threat to your profit.
Maintenance Burn Rate is the average annual cost of unexpected, unscheduled repairs per rental unit. It measures your property’s true financial volatility.
Standard Profit & Loss Statements combine planned and unplanned maintenance together. Burn Rate isolates only the emergencies by excluding capital expenditures, routine maintenance, and cosmetic updates. This reveals the patterns of what is actively draining your cashflow.
For investors in Rockland County with small multifamily properties (2-4 units), a sustainable Burn Rate falls between $450 and $900 per unit, per year. For larger properties the end lowers to $350-750. A number consistently outside of that range signals trouble: either your property is threatened by constant volatile expenses, or unscheduled maintenance is quietly draining the passive income you built the portfolio for.
Standard accounting reports can show you how much you spent on maintenance last quarter, but they can’t reveal that a large portion of it was driven by emergency maintenance. A year of unplanned repairs leaves your cash flow vulnerable, and budgeting becomes impossible.
That’s exactly what the Maintenance Burn Rate solves. Instead of just documenting all expenses, it isolates the cost of unscheduled repairs per unit, per year. This number exposes hidden patterns of emergencies draining your income, signaling anything from deferred maintenance to careless tenants or poor workmanship.
Consider a 4-unit rental in Rockland County. No preventive maintenance was in place, and every repair was reactive. Over 36 months, emergencies piled up:
| METRIC | VALUE |
|---|---|
| Annual Gross Rent | $135,768 |
| Total Unscheduled Repairs (36 months) | $127,400 |
| Maintenance Burn Rate (per unit/year) | $10,617 |
| Sustainable Range (2-4 units) | $450–900 |
| Emergency Repairs as % of Gross Rent | 31.3% |
Each unit bled over $10,600 a year on emergencies alone, more than 10 times the upper limit of a healthy burn rate. That’s nearly a third of all rent collected, gone before mortgage, taxes, or profit. A high burn rate doesn’t just signal a maintenance problem; it signals a profit problem. This metric gives you the early warning system traditional accounting never could.
This guide will show you how to calculate, interpret, and use Burn Rate to turn maintenance from an unpredictable worry into a planned, manageable part of your investment strategy.
To manage your Burn Rate, you need to measure it first. This guide walks you through the calculation step by step.
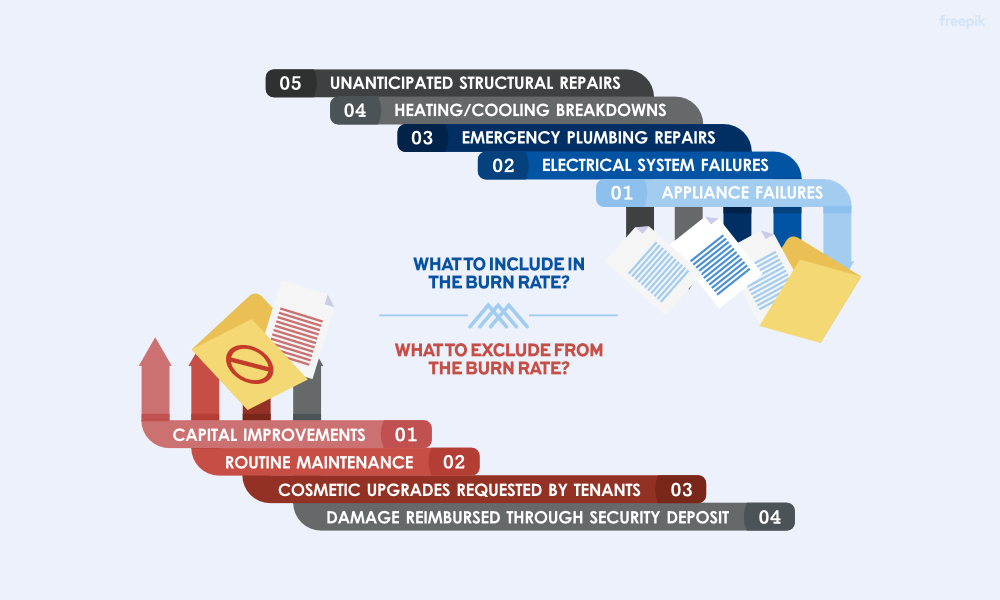
What counts as an unscheduled repair? Think appliance failures, electrical system breakdowns, emergency plumbing, heating/cooling failures, and unanticipated structural fixes. These unplanned expenses cause your maintenance budget to fall short.
What should you leave out of the calculation? Capital improvements, routine scheduled maintenance, cosmetic upgrades requested by tenants, and any damage that was reimbursed through a security deposit. Exclude these so the Burn Rate reflects only true financial volatility.
The funnel graphic below shows this filtering process at a glance.
Using the 4‑unit Rockland County property we analyzed earlier as our example, here’s how to turn its unscheduled repair costs into a Maintenance Burn Rate.
Divide the total unscheduled maintenance costs by the number of months in the period you are analyzing.
If your total was 127,400 over 36 months that gives you an average cost of emergency repairs of 3,538.89.
Multiply that monthly average by 12 to annualize it.
Multiplying $3,538.89 by 12 results in a total yearly cost of unscheduled repairs for the whole property of 42,466.67.
Divide that yearly number by the number of rental units.
Dividing 42,466.67 by the 4 units in our example gives you a Maintenance Burn Rate of 10,617 per unit, per year.
A Burn Rate of $10,617 sits more than 10 times above the sustainable range of $450-900 per unit, per year. This property is turning into a volatile asset, as neglected systems trigger even larger expenses year after year.
Your Maintenance Burn Rate is a portfolio diagnostic tool for your portfolio. Use the framework below to identify which of three conditions your property falls into, what it means and what to do next.
See the table for a quick overview:
| BURN RATE RANGE | DIAGNOSIS | PRIMARY ACTION |
|---|---|---|
| 450–900/unit/year | Healthy: predictable costs, stable income | Keep clear maintenance records |
| Below $450/unit/year | Red flag: likely deferred maintenance | Schedule a professional inspection |
| Above $900/unit/year | Cash Drain: repeat emergencies or poor workmanship | Audit repair patterns and vendors |
This is the target zone for stable, passive income. A Burn Rate in this range means your property’s systems are maintained proactively.
What this means for your property:
What to do next:
Keep documenting all maintenance. Clean records enhance property value and attract future buyers.
A low Burn Rate can be a false positive, and a major red flag. It often signals deferred maintenance: postponing necessary repairs to save cash in the short-term.
What this means for your property:
What to do next:
A high Burn Rate means your property is actively losing income. The root cause usually falls into one of two things: recurring system failures, or repairs handled poorly at inflated costs.
What this means for your property:
What to do next:
Colonial Property Management services keep unscheduled repair costs predictable for owners in the New York Tri-State area. Our monthly reports and property inspections catch small issues before they become expenses emergencies.
Managing vendors, coordinating repairs, and tracking maintenance patterns across a portfolio is a time-consuming task that directly impacts your cash flow. We simplify this entire process by acting as your dedicated property manager.
Pick one system closest to failure, based on age and repair frequency, and target that first. Even $200-300 per month builds toward a furnace replacement in about two years. For a 3-unit in Rockland County, a furnace runs $4,000-7,000. The goal is to stop funding every emergency from your operating account.
Pull every invoice from the past year and ask three things: Was the issue fixed in one visit? Does the price match the scope of work? Was this truly an emergency, or could it have been scheduled at a lower rate? Compare invoices for the same system and request upfront rate sheets from any new vendor.
Not necessarily. Age matters less than maintenance history. A 1970s property with updated HVAC, modern plumbing, and a replaced roof can easily sit inside the $450-900 range. If major systems are near or past their expected lifespans with no replacement plan, that will reflect in your burn rate.
Yes. Start with what you have: bank statements, invoices, text messages with your handyman. Separate each expense into scheduled or unscheduled. Your numbers will get more accurate over time, but the most important move is to start tracking today.